

RESOURCE
Power BI Financial Statements
Power BI Template for finance teams to move from Excel to Power BI


Power BI Template for finance teams to move from Excel to Power BI

Financial data is the backbone of every business decision.
But too often, finance teams juggle between endless spreadsheets and outdated reports.
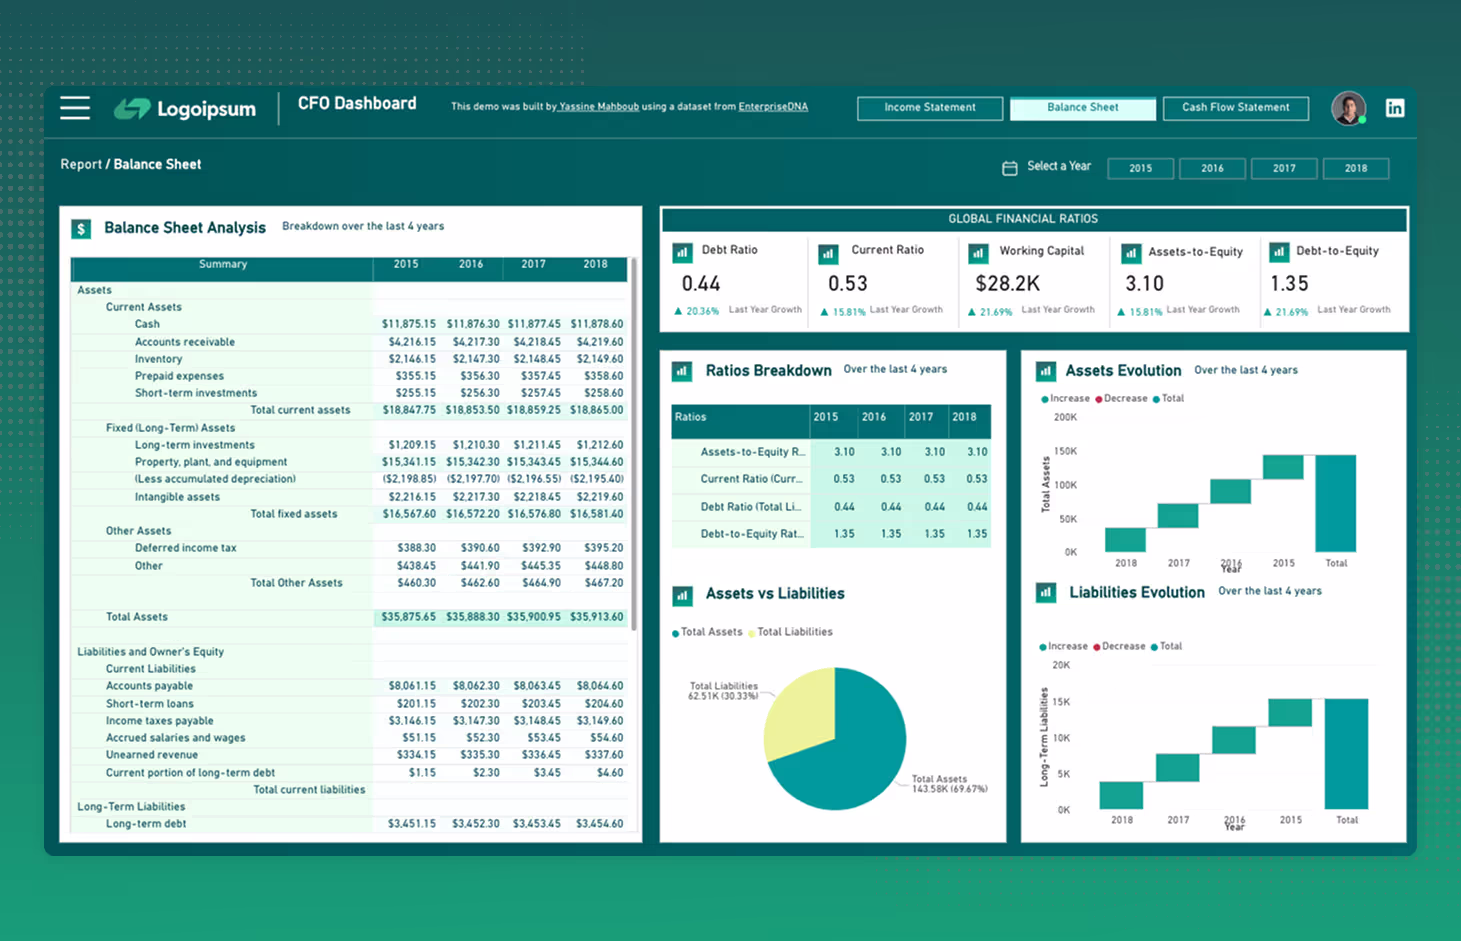
A well-built CFO Dashboard transforms financial data into a strategic asset and provides a real-time, consolidated view of company performance.
In this 4th post of the Power BI Breakdown series, I’m sharing a demo of a Financial Analytics Dashboard built for CFOs, finance teams, and decision-makers.
This dashboard answers key financial questions:
⤷ How is our cash flow evolving?
⤷ Are we financially healthy? (Debt ratio, current ratio, assets vs. liabilities)
⤷ What’s driving our profitability? (Revenue, gross profit, net margin)
However, one of the most challenging parts of building a CFO dashboard is data modeling.
Often, data is siloed across various sources, such as:
🔹 ERP & Accounting Systems (SAP, NetSuite, QuickBooks) → Revenue, expenses, balance sheet
🔹 Banking & Payments (Stripe, PayPal, bank transactions) → Cash flow tracking
🔹 Payroll & HRIS (ADP, Workday) → Salary and benefit costs
🔹 CRM & Sales Data (Salesforce, HubSpot) → Revenue pipeline
And that’s just the beginning…
That’s why you need a solid data infrastructure and a well-structured data mart.
Power BI helps you bring all this data together and no longer rely on static reports.


Whether you're a business owner or recruiter looking to hire a data analytics consultant, I’m open to connect with you on LinkedIn.
Free Insights That I Should Probably Charge Money For
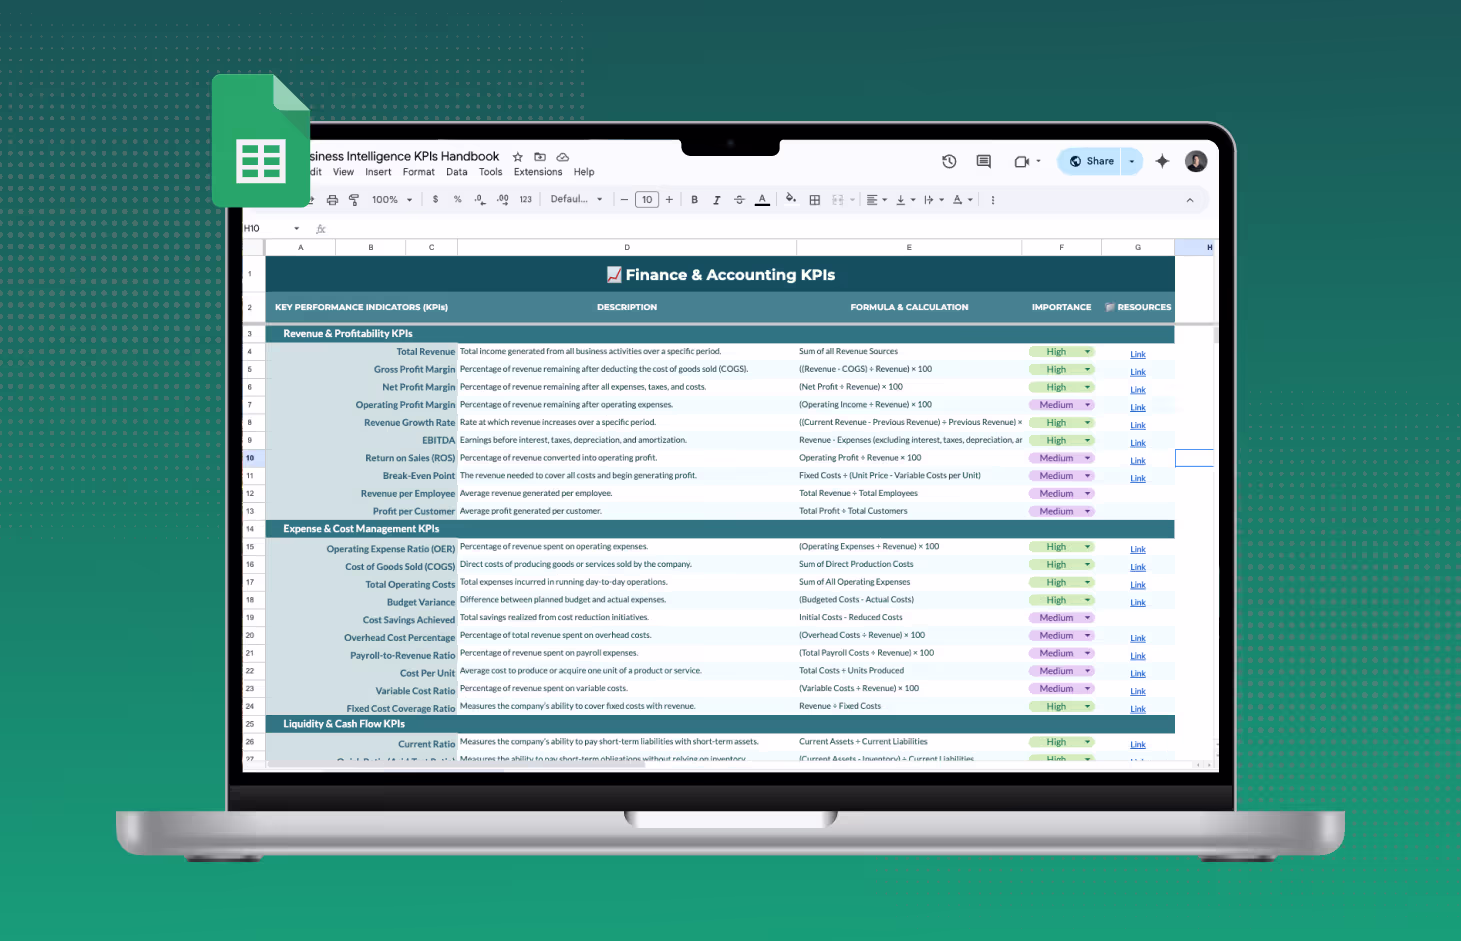
Every KPI you'll ever need, in one place. Eliminates the guesswork so you can focus on what matters
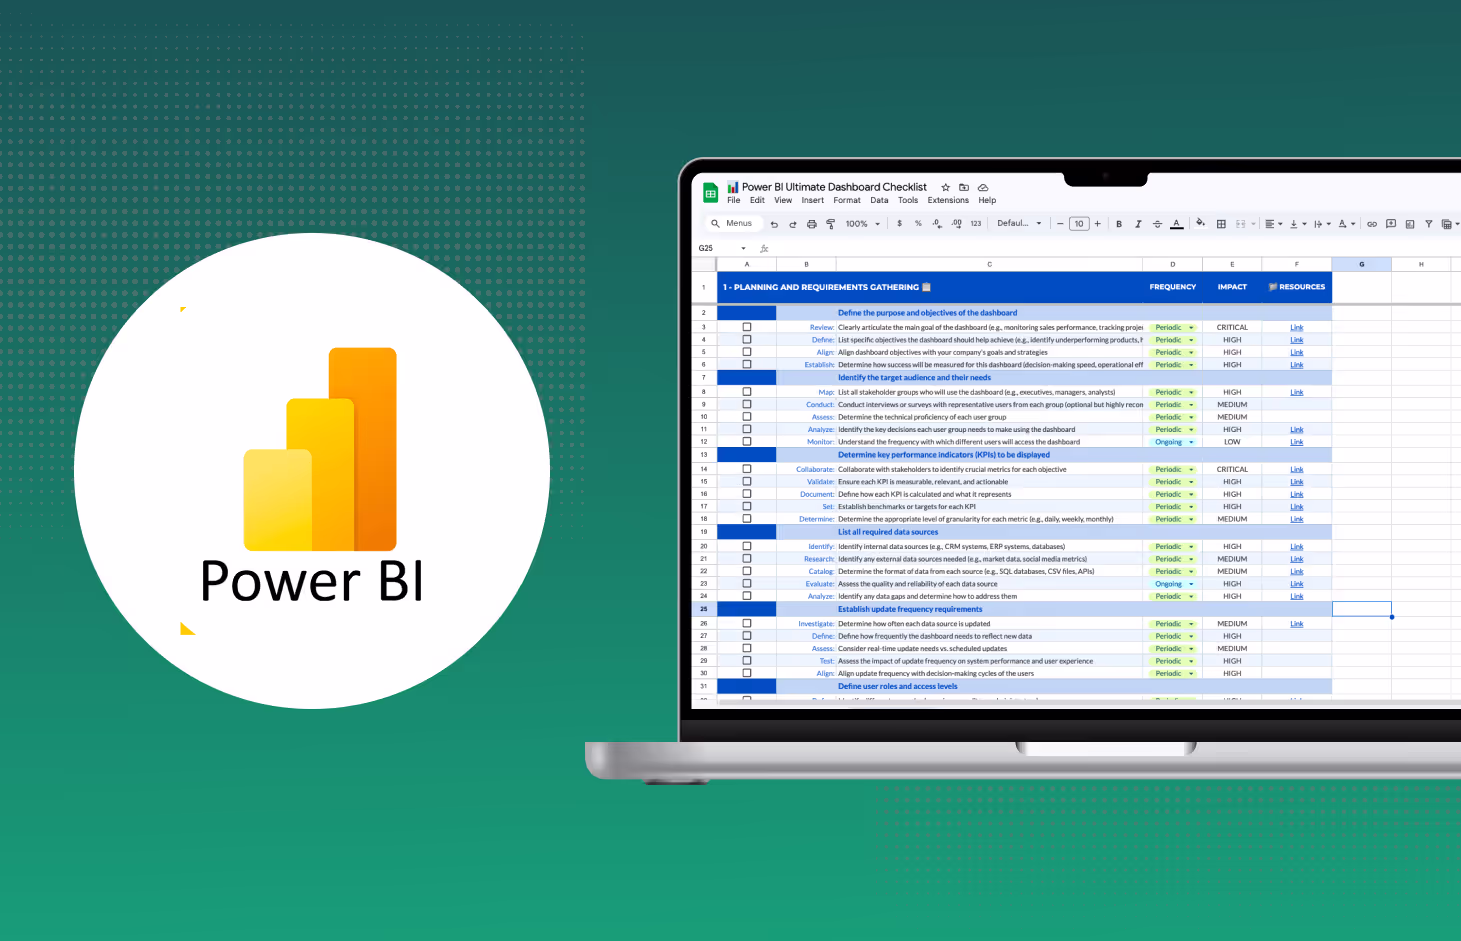
This checklist covers the entire lifecycle of a Power BI project, from conception to deployment.
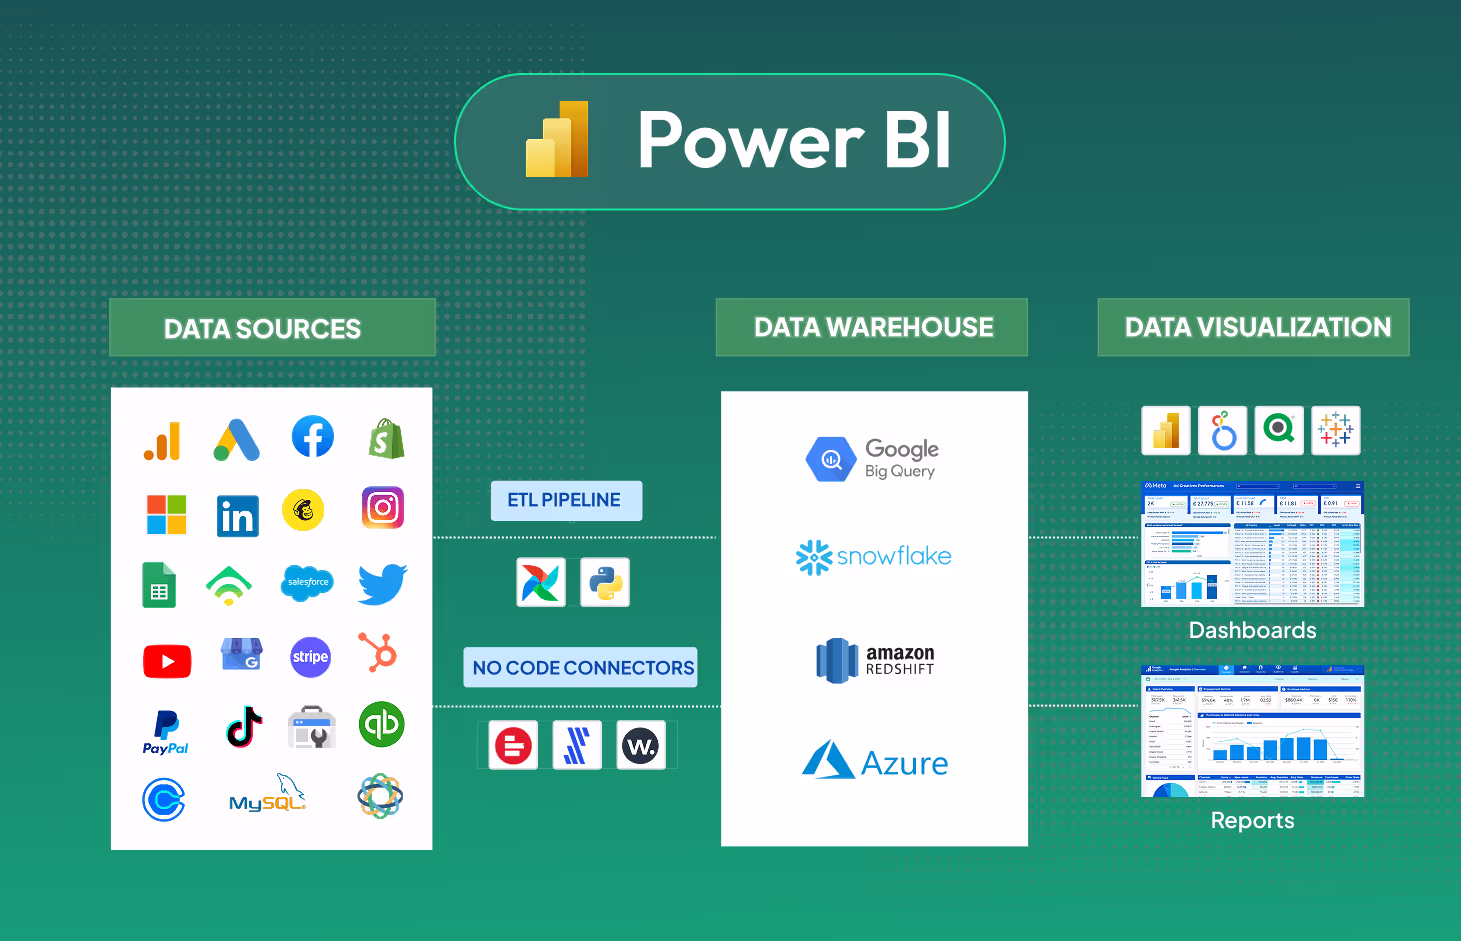
Comprehensive guide on using no-code ETL data connectors with Microsoft Power BI